Product quality has always been, and will remain to be, a constant focus and challenge for process manufacturing companies. Luckily, today’s changing landscape brings new ways for industry to strive for, and achieve, operational excellence through the use of “big data.” Big data and other components of the Industrial Internet of Things (IIOT) have opened new ways to continuously improve product quality. Self-service advanced analytics, in particular, now allows subject matter experts to contribute to operational excellence and meet corporate quality and profitability objectives.
Process engineers, empowered with self-service advanced analytics are crucial to quality assurance at the heart of the production process. By contextualizing process performance with quality data, customer expectations can be met or even exceeded. Continuous operational improvements will help reduce costs related to waste, energy, and maintenance, and increase yield with quality products, leading to the improved profitability of the production site.
Defining product quality
A modern definition of quality is "fitness for intended use," which implies meeting, or even exceeding, customer expectations. Another way of looking at defining quality is what actually impacts the product quality before it is used by the customer.

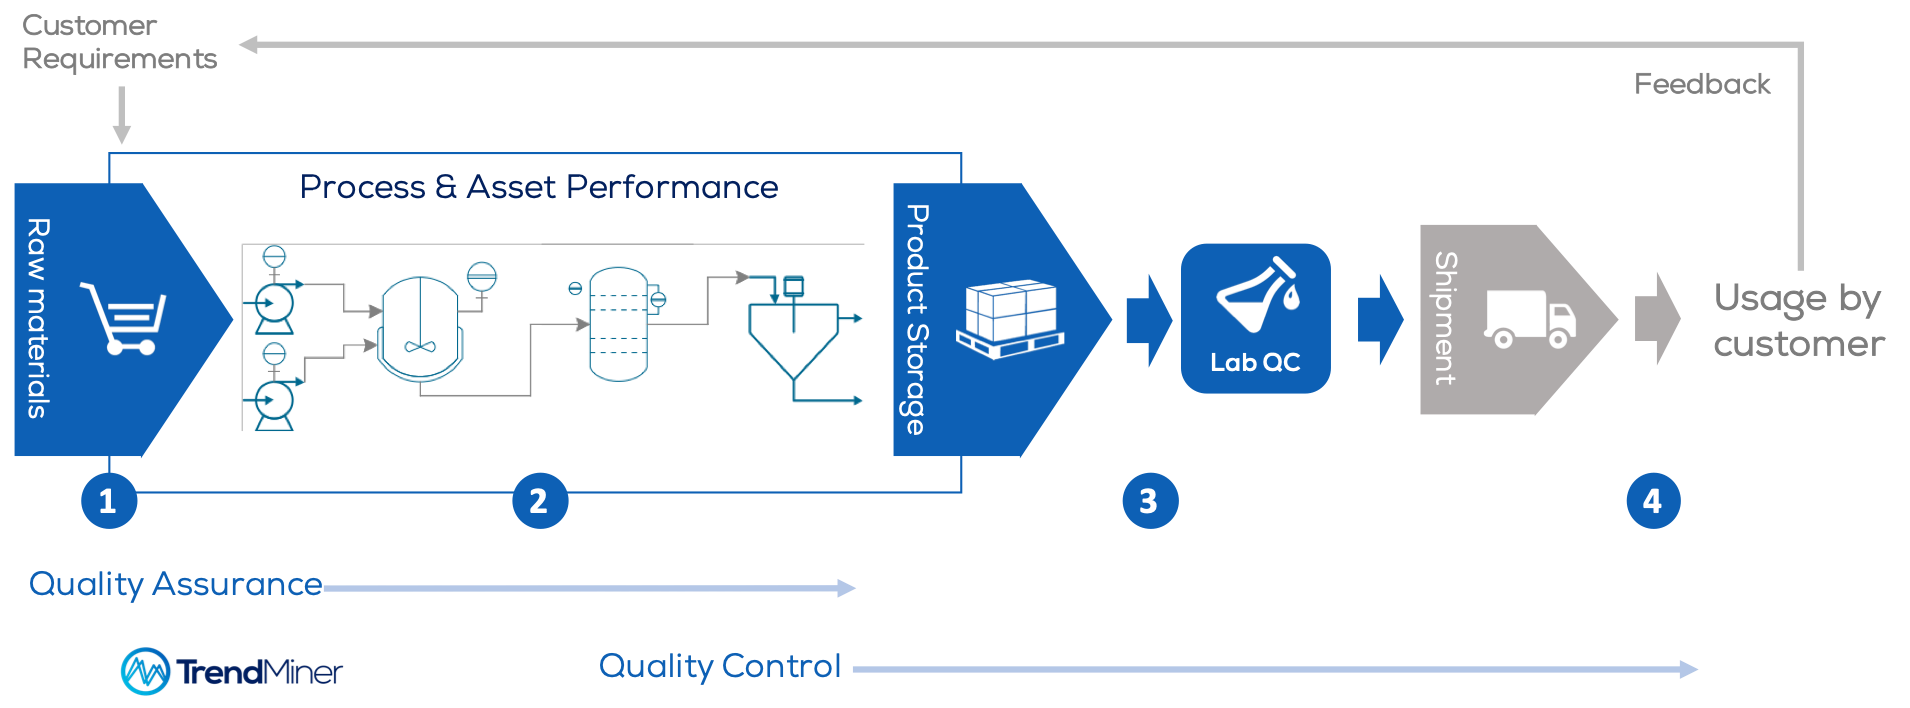
Figure 1. Product quality is impacted and controlled in various stages before it is used by the customer
The first factor impacting product quality is the raw material that enters the production process. Raw materials are often natural materials that typically have varying consistencies, and may require adjustments through processing in order to maintain an unvarying quality level of the finished product.
The second factor is the performance of the production line itself. The design and configuration of the production line impacts the process and asset performance, which also impact each other. One example of materials impacting asset performance (overall equipment effectiveness) would be the fouling of heat exchangers due to the substance running through the tubes. On the other hand, the performance of the asset can impact product processing circumstances, for example a pressure-drop due to a malfunctioning pump. To achieve a consistent production level, while remaining both safety-compliant and cost-effective, a process control system is usually in place.
The (intermediate) product quality can be tested and monitored during production, but to know if the product meets the requirements, laboratory tests are done in accordance with the procedures of the product control systems.
The last factors impacting the product quality are the storage and shipment conditions of the product. The packaging, handling and environment may impact how long the product remains within specification.
For the customer, the product they’ve received might be considered as raw material for their production process. When using the products within their production process, the customer will gather their own quality data and will provide feedback to the supplier to improve future deliveries of the ordered goods. This feedback is closing the top loop in Figure 1.
Quality control and assurance
Quality control (QC) and quality assurance (QA) are two of the main activities that are required to ensure the quality of the product. QC and QA are closely related, but different concepts. One way of looking at it would be to think of QC as detecting errors in the product and QA as preventing quality problems.
Typically, QC is done after the fact, while QA includes activities to prevent quality problems that require systematic measurement, comparison with a standard, monitoring of processes, and an associated feedback loop. The key to quality assurance lies within sensor-generated time-series production data.

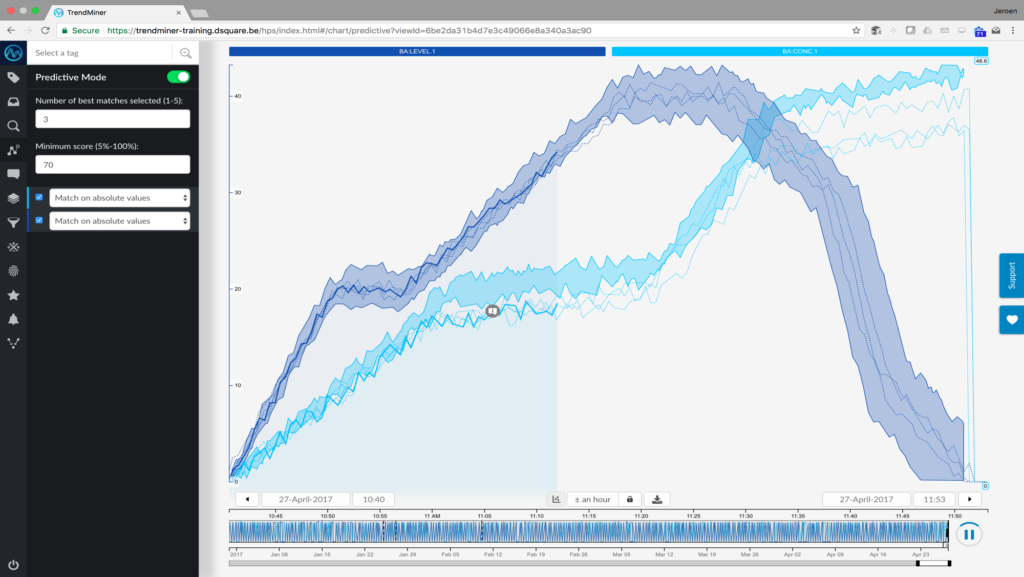
Figure 2. Self-service analytics assess and assure product quality with process data. (Image courtesy of TrendMiner)
With today’s increasing computing power, time-series process and asset data can be easily visualized (Figure 2). Process experts can use the visualization and pattern recognition capabilities of self-service analytics tools to assess production processes. By empowering process engineers with advanced analytics tools, many more production issues can be directly assessed to interpret the data. Process data already gives good options to assure product quality through self-service analytics.
Making the connection between quality and process data
All data captured during the production process can be used to assure the product quality (which can also be later improved with the use of historical data) and aid in visual root-cause analysis, but this is still a bit like driving in the dark without streetlights, road signs, or navigation. What is needed is contextualization of the process data.
One part of contextualization is tying the quality test data from the laboratory to the process data, particularly in instances of batch production, where the context of a batch (such as batch number and cycle time) can be linked to the test data from the laboratory. This ensures that each specific batch run is tied not only to its process data but also its own quality data. The linked information enables quick assessments of the best runs for creating golden batch fingerprints to monitor future batches. It also helps to analyze the underperforming batches to improve the production process.

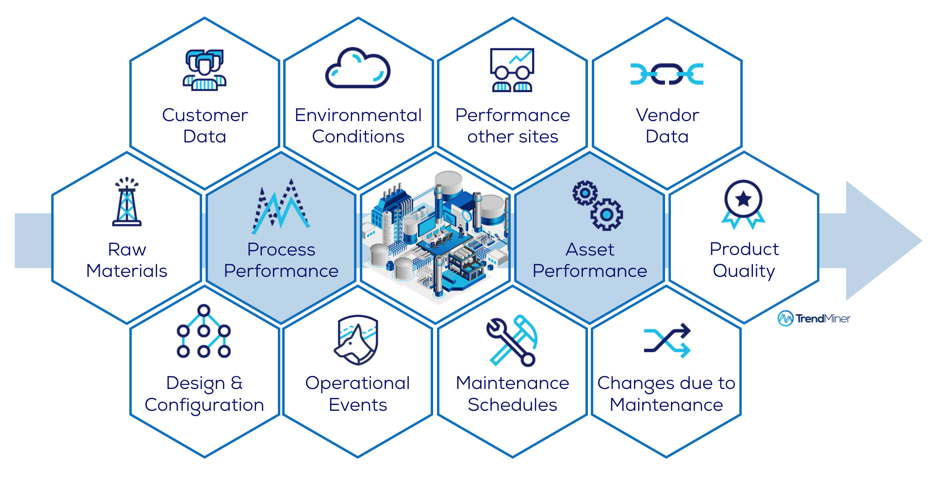
Figure 3. Many factors influence operational performance and therefore the product quality, which can be included to analyze, monitor and predict operational performance
Another part of contextualization is capturing events during the production process, such as maintenance stops, process anomalies, asset health information, external events, production losses and more. The degrading performance of equipment can indicate that the product quality will be impacted, which can be used to assure product quality. All of this contextual information helps to better understand operational performances and get more indications from the self-service analytics platform to start optimization projects.
Edited by Dorothy Lozowski

Edwin van Dijk
Author
Edwin van Dijk is the VP of marketing for Trendminer (www.trendminer.com). He has over 20 years of experience in bringing software solutions for the process and power industries to market. Various roles from business consultancy to product management gave van Dijk the experience to expand TrendMiner’s footprint in the market.
